Introduction
In this Tutorial we will build a sample application to display Price Changes for a Token across an Interval. The Changes can be across “ALL”,“MONTH”,“WEEK”,“DAY”,“HOUR” in Unix timestamp.Prerequisites
Before starting, ensure you have the following:- Node.js installed on your machine.
- Code Editor: Use your preferred code editor; VS Code is recommended.
- An EOA wallet with a private key. You can use an existing one or create a new wallet.
- A basic understanding of React.js and Next.js.
- An API key from the Fuse Console. Get one here.
Step 1: Set Up a Next.js Project
If you haven’t already set up a Next.js project, you can create one using the following commands: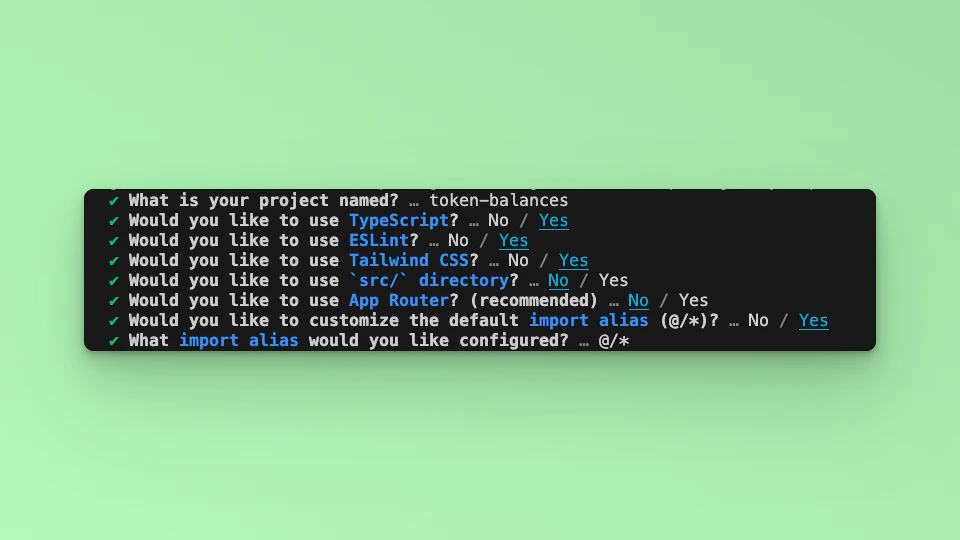
Step 2: API Endpoint
In this example tutorial, we are going to build a Dashboard that returns the Price Changes for the LadyBot Token in a Line Chart. We will use the Fetch API method to call the Fuse REST APIs and return the responses. The end point that we will use in this tutorial is the GET Price Change for a Token Over An Interval. The base URLhttps://api.fuse.io/api/v0/trade/pricechange/interval/:timeFrame/:tokenAddress?apiKey={API_KEY}
Where timeFrame is the Interval for price change. Allowed values are: “ALL”, “MONTH”, “WEEK”, “DAY”, “HOUR”.
and tokenAddress is the Token Contract Address. You can get an API KEY from Console.
The URL when appended with the parameters for examples:
https://api.fuse.io/api/v0/trade/pricechange/interval/HOUR/0xDe4b9879B56187D13B2c41Da24c72Ff100A5AC9A?apiKey={API_KEY}
Step 3: Understanding the API Response
The URL will return the following response, for example:
An example response from calling the URL looks like this:
timestamp on the y-axis and the currentPrice on the x-axis of the line chart.
Step 4: Fetch the API response.
In this step, we will test calling the API and parsing the response to the web browser console. Add the following code to index.tsx before the return statement.Step 5: UI
TO display the response in a Chart using a Line Chart, we will make use of the react-chartjs-2 Library. A set of React components for Chart.js a JavaScript charting library. Install the following packages:Line component takes in a series of parameters, the two most important being options and data. We are going to create an options and data variables:
labels as a parameter, which the y-axis and data going on the x-axis. As mentioned above, we will parse timeStamp to the y-axis and currentPrice to the x-axis. To do this we will map over the response stored in the token state.
For the timeStamp we will convert it to human readable date time in “Hours”, “Minutes” and “Seconds”..
return statement.
http://localhost:3000 in your browser to see the application in action.
Checkout the complete code. 💻