REST API - How to GET Price Changes for a Token By Intervals
Introduction
In this Tutorial we will build a sample application to display Price Changes for a Token across an Interval. The Changes can be across "ALL","MONTH","WEEK","DAY","HOUR" in Unix timestamp.
Prerequisites
Before starting, ensure you have the following:
- Node.js installed on your machine.
- Code Editor: Use your preferred code editor; VS Code is recommended.
- An EOA wallet with a private key. You can use an existing one or create a new wallet.
- A basic understanding of React.js and Next.js.
- An API key from the Fuse Console. Get one here.
Step 1: Set Up a Next.js Project
If you haven't already set up a Next.js project, you can create one using the following commands:
npx create-next-app my-project
cd my-project
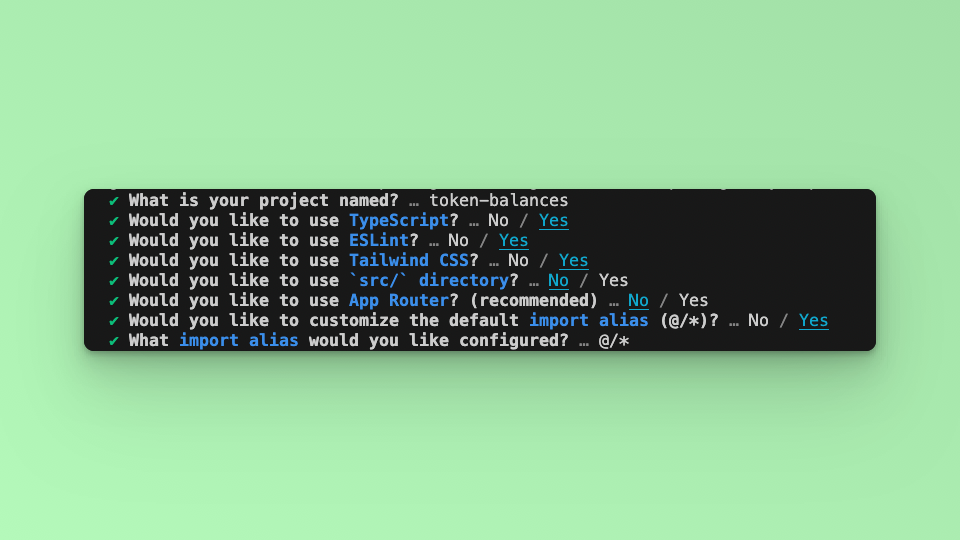
Answer the required prompts from NextJS in the terminal. Note that we use TypeScript and Tailwind CSS for this application.
Step 2: API Endpoint
In this example tutorial, we are going to build a Dashboard that returns the Price Changes for the LadyBot Token in a Line Chart. We will use the Fetch API method to call the Fuse REST APIs and return the responses.
The end point that we will use in this tutorial is the GET Price Change for a Token Over An Interval.
The base URL https://api.fuse.io/api/v0/trade/pricechange/interval/:timeFrame/:tokenAddress?apiKey={API_KEY}
Where timeFrame is the Interval for price change. Allowed values are: "ALL", "MONTH", "WEEK", "DAY", "HOUR".
and tokenAddress is the Token Contract Address. You can get an API KEY from Console.
The URL when appended with the parameters for examples:
https://api.fuse.io/api/v0/trade/pricechange/interval/HOUR/0xDe4b9879B56187D13B2c41Da24c72Ff100A5AC9A?apiKey={API_KEY}
Step 3: Understanding the API Response
The URL will return the following response, for example:
{
  "data": [
    {
      "timestamp": 0,
      "priceChange": "string",
      "previousPrice": "string",
      "currentPrice": "string"
    }
  ]
}

….
Where:
| Param | Type | Description |
|---|---|---|
| timeStamp | integer | a Unix timestamp (which is the number of seconds since January 1, 1970) |
| priceChange | string | The difference between previousPrice and currentPrice |
| previousPrice | string | The Previous Price at the timestamp |
| currentPrice | string | The Current Price at the timestamp |
An example response from calling the URL looks like this:
{
    data: [
        {
        timestamp: 1714626000,
        priceChange: 0,
        previousPrice: 0.22263642188397303,
        currentPrice: 0.22263642188397303
        },
        {
        timestamp: 1714626099,
        priceChange: 0,
        previousPrice: 0.22263642188397303,
        currentPrice: 0.22263642188397303
        },
        {
        timestamp: 1714626198,
        priceChange: 0.024984737664834156,
        previousPrice: 0.22263642188397303,
        currentPrice: 0.22269204700992712
        },
        …
    ]
}
We will track the timestamp on the y-axis and the currentPrice on the x-axis of the line chart.
Step 4: Fetch the API response.
In this step, we will test calling the API and parsing the response to the web browser console. Add the following code to index.tsx before the return statement.
const apiUrl = `https://api.fuse.io/api/v0/trade/pricechange/interval/HOUR/0xDe4b9879B56187D13B2c41Da24c72Ff100A5AC9A?apiKey={API_KEY}`

async function fetchData() {
    try {
      const response = await fetch(apiUrl);
      if (!response.ok) {
        throw new Error('Network response was not ok');
      }
      const data = await response.json();
      console.log(data);
      } catch (error) {
      console.error('There was a problem with the fetch operation:', error);
    }
  }

fetchData();
Save the file.
Run the application using the command:
npm run dev
Open your browser go to http://localhost:3000 and open the developer console, you will find the results logged to the console.
Step 5: UI
TO display the response in a Chart using a Line Chart, we will make use of the react-chartjs-2 Library. A set of React components for Chart.js a JavaScript charting library. Install the following packages:
npm install chart.js react-chartjs-2
To parse the responses via the UI, we will use React useState to update the UI components. Create an interface to handle the Token response object:
interface Token {
    timestamp: number
    priceChange: string
    previousPrice: string
    currentPrice: string
}
Add the useState Hook from React
import { useState, useEffect } from "react";
Create a state to store the responses from the Fetch call using the Token interface.
const [priceData, setPriceData] = useState<Token[]>([]);
Update the FetchData function by parsing the data response to the state:
        const response = await fetch(apiUrl);
        if (!response.ok) {
          throw new Error('Network response was not ok');
        }
        const data = await response.json();
        setPriceData(data.data);
To create the Chart import the required methods:
import {
  Chart as ChartJS,
  CategoryScale,
  LinearScale,
  PointElement,
  LineElement,
  Title,
  Tooltip,
  Legend,
} from 'chart.js';
import { Line } from 'react-chartjs-2';

 ChartJS.register(
  CategoryScale,
  LinearScale,
  PointElement,
  LineElement,
  Title,
  Tooltip,
  Legend
);
The Chart JS Line component takes in a series of parameters, the two most important being options and data. We are going to create an options and data variables:
const options = {
    responsive: true,
    plugins: {
      legend: {
        position: 'top' as const,
      },
    },
  };
const data = {
    labels,
    datasets: [
      {
        label: 'LadyBot Token Price Change Per Hour',
        data: priceData.map((token) => token.currentPrice),
        borderColor: 'rgb(255, 99, 132)',
        backgroundColor: 'rgba(255, 99, 132, 0.5)',
      },
     ],
  };
The Data object variable has labels as a parameter, which the y-axis and data going on the x-axis. As mentioned above, we will parse timeStamp to the y-axis and currentPrice to the x-axis. To do this we will map over the response stored in the token state.
For the timeStamp we will convert it to human readable date time in “Hours”, “Minutes” and “Seconds”..
const labels = priceData.map(token => {
      const date = new Date(token.timestamp * 1000);
      const hours = date.getHours();
      const minutes = date.getMinutes();
      const seconds = date.getSeconds();

      return `${hours < 10 ? '0' : ''}${hours}:${minutes < 10 ? '0' : ''}${minutes}:${seconds < 10 ? '0' : ''}${seconds}`;
    });
To display the Chart add the Line Component after the “Hello, World!” inside the return statement.
<Line options={options} data={data} />
Save the file. Run the application using the following command:
npm run dev
Visit http://localhost:3000 in your browser to see the application in action.
Checkout the complete code. 💻